Article
New in Looker: self-service Explores, tabbed dashboards, and custom themes

Data teams seem to be constantly balancing the need for governed, trusted metrics with business needs for agility and ad-hoc analysis. To help bridge the gap between managed reporting and rapid data exploration, Google Cloud is introducing several new features in Looker, to expand users’ self-service capabilities. These updates allow individuals to analyze local data alongside governed models, organize complex dashboards more effectively, and align the look and feel of their analytics with corporate branding, all within the Looker platform.
Analyze ad-hoc data with Looker self-service Explores
Valuable data often exists outside of the primary database — whether in budget spreadsheets, sales lists, or ad-hoc research files. With self-service Explores, now in Preview, users can upload CSV and spreadsheet-based data using a drag-and-drop interface directly within Looker.
This feature allows users to combine local files with fully modeled Looker data to test new theories and enrich insights. Once uploaded, users can visually add new measures and dimensions to their self-service Explores, customize them, and share the results via dashboards and Looks.
Uploading a CSV file and creating a new self-service Explore in just a few clicks
To maintain governance, administrators retain oversight regarding which files are uploaded to the Looker instance and who has permission to perform uploads. Additionally, Google Cloud has introduced a new content certification flow, which makes it easier to signal which content is the vetted, trusted source of truth, ensuring users can distinguish between ad-hoc experiments and certified data.
Certifying a self-service Explore
Upload data and content certification are available in Public Preview as of Looker 25.20.
Deliver clearer, cohesive data stories with tabbed dashboards
The new tabbed dashboard feature helps dashboard editors organize complex information into logical narratives, moving away from dense, single-page views. Editors can now streamline content creation with controls for adding, renaming, and reordering tabs.
For the viewer, the experience is designed to be seamless. Filters automatically pass values across the entire dashboard, while each tab displays only the filters relevant to the current view, reducing visual clutter. Users can share unique URLs for specific tabs and schedule or download the comprehensive multi-tab dashboard as a single PDF document.
Navigating between tabs on a multi-tab dashboard
This feature is currently available in preview.
Apply custom styling to dashboards
Matching internal dashboards to company branding can help create a familiar data experience and increase user engagement. Google Cloud is announcing the Public Preview of internal dashboard theming, which allows creators to apply c
ustom changes to tile styles, colors, fonts, and formatting directly to dashboards consumed inside the Looker application.
Applying custom theming for internal dashboards
With this feature, you can save, share, and apply pre-configured themes to ensure consistency. Users with permission to manage internal themes can create new templates for existing dashboards or select a default theme to apply across the entire instance.
You can enable Internal dashboard theming today on the Admin > Labs page.
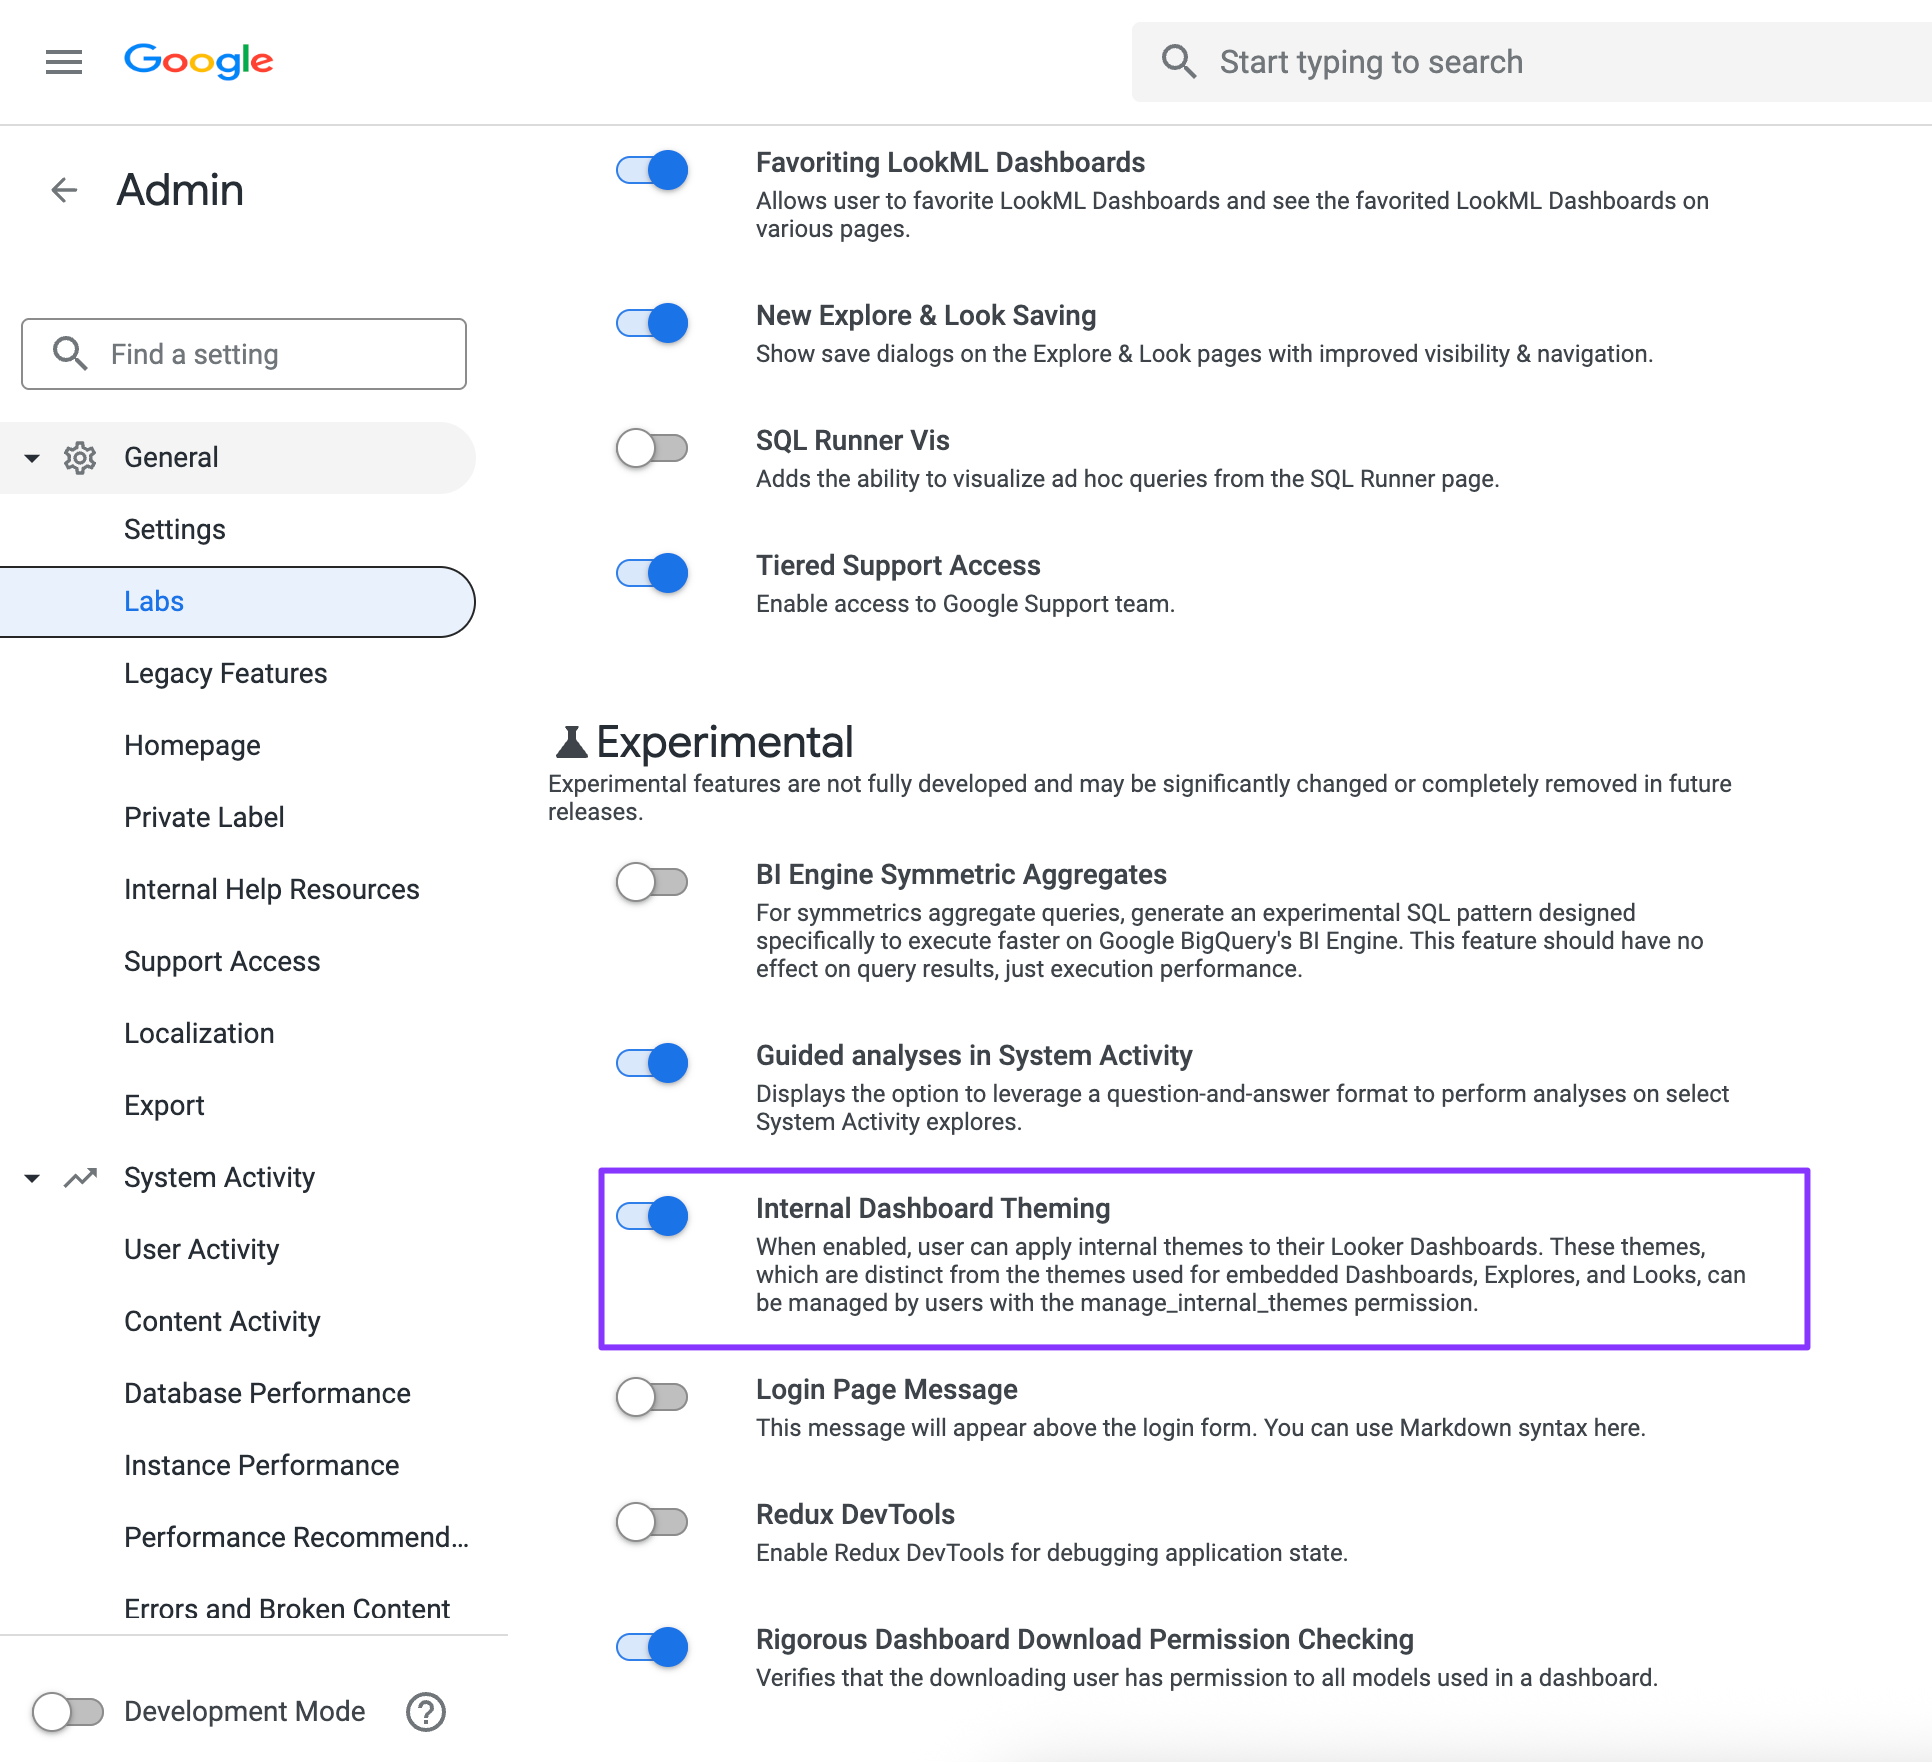
Enabling the preview for internal dashboard theming
Get started
These new self-service capabilities in Looker are designed to help you and all users in your organization get more value out of your data by improving presentation flexibility and quality.
Related News

Extending Network Reachability of Vertex AI Pipelines
See Detail
New in Looker: self-service Explores, tabbed dashboards, and custom themes
See Detail
How to deploy Tink for BigQuery encryption on-prem and in the cloud
See Detail