Announcing new simple query options in Cloud Logging
When you’re troubleshooting an issue, finding the root cause often involves finding specific logs generated by infrastructure and application code. The faster you can find logs, the faster you can confirm or refute your hypothesis about the root cause and resolve the issue. Today, Google are pleased to announce a simpler way to find logs in Logs Explorer.
Making querying even easier
Over the past 2 years, Google heard feedback that many users needed simple free text search to find their logs. They also heard that users wanted to build a query using the dropdown selectors. They took all that feedback to heart and made many critical changes to the Logs Explorer to address this feedback and make searching logs even easier.
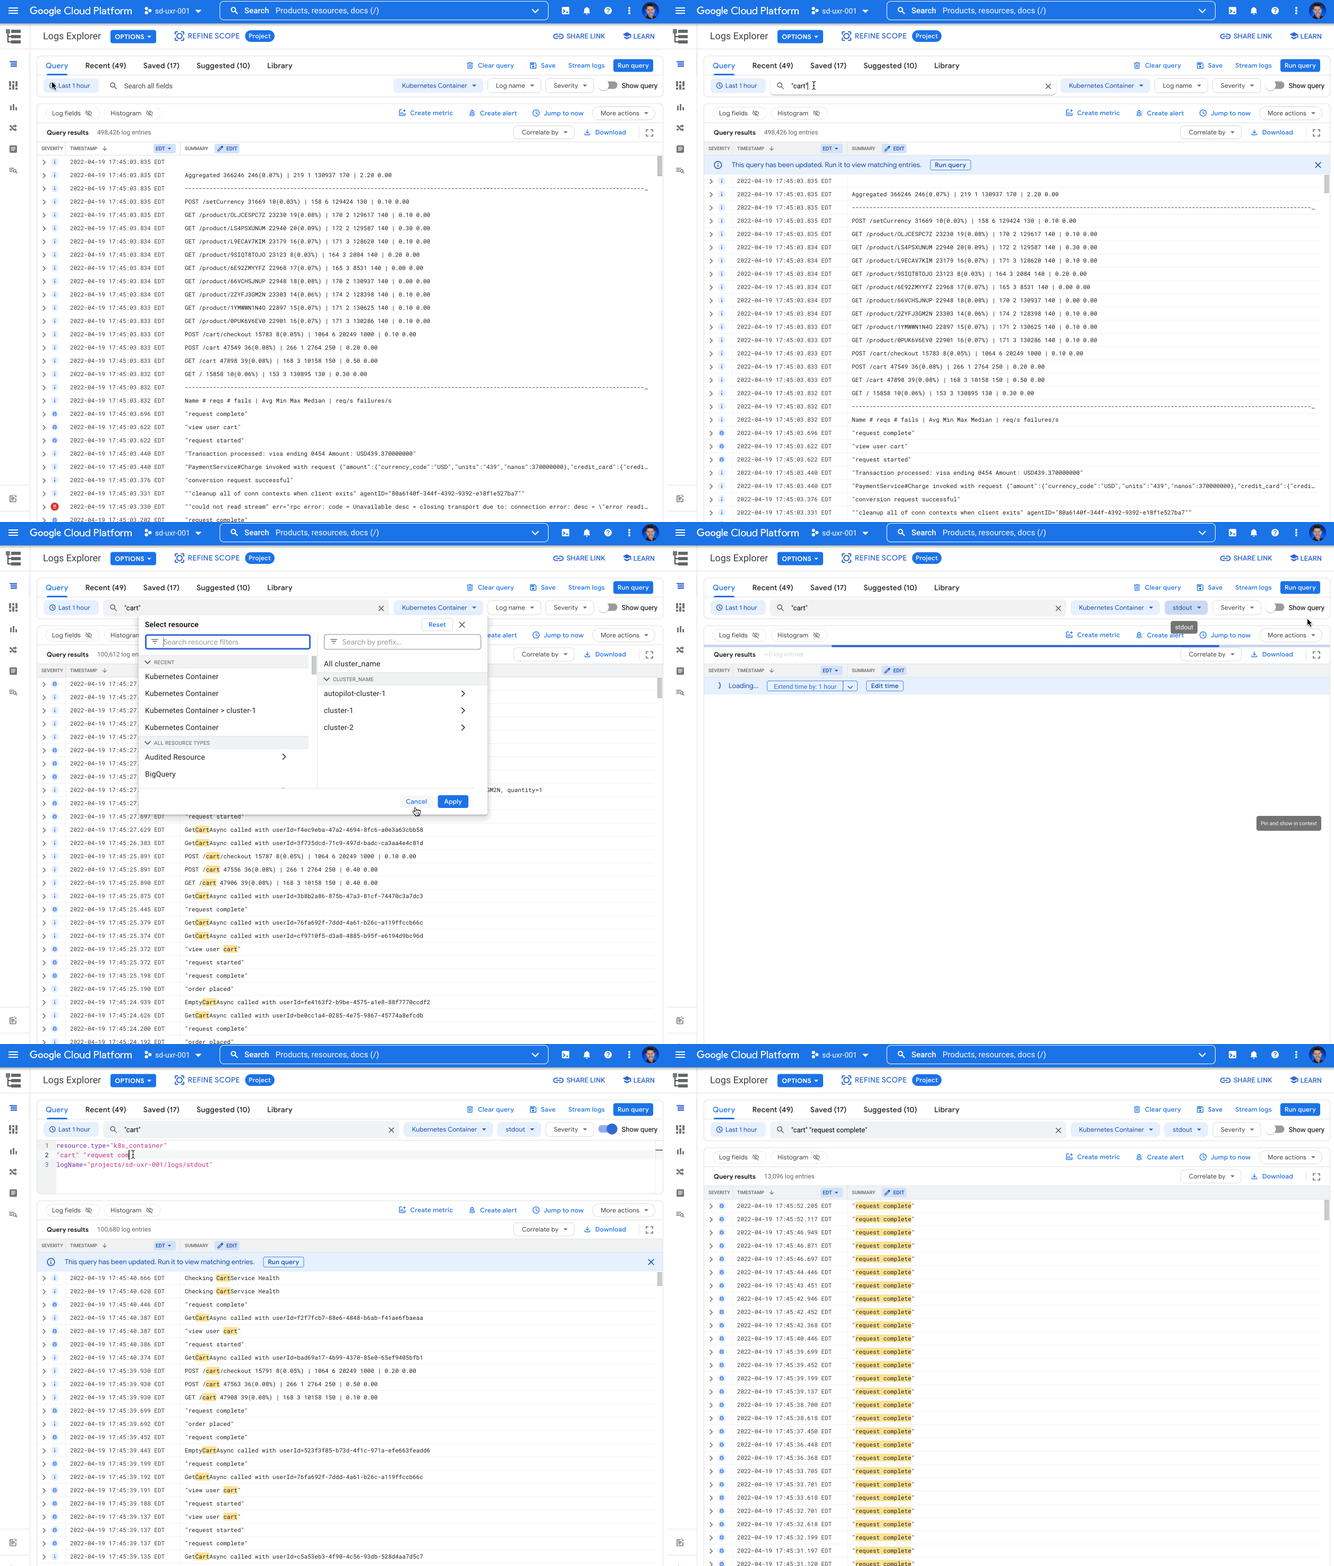
- Simple text search – a new simple text search box for global text searches
- Advanced query – a new toggle to show/hide the Logging query language for the query
- Date/time picker – the date/time range picker is now a part of the query builder
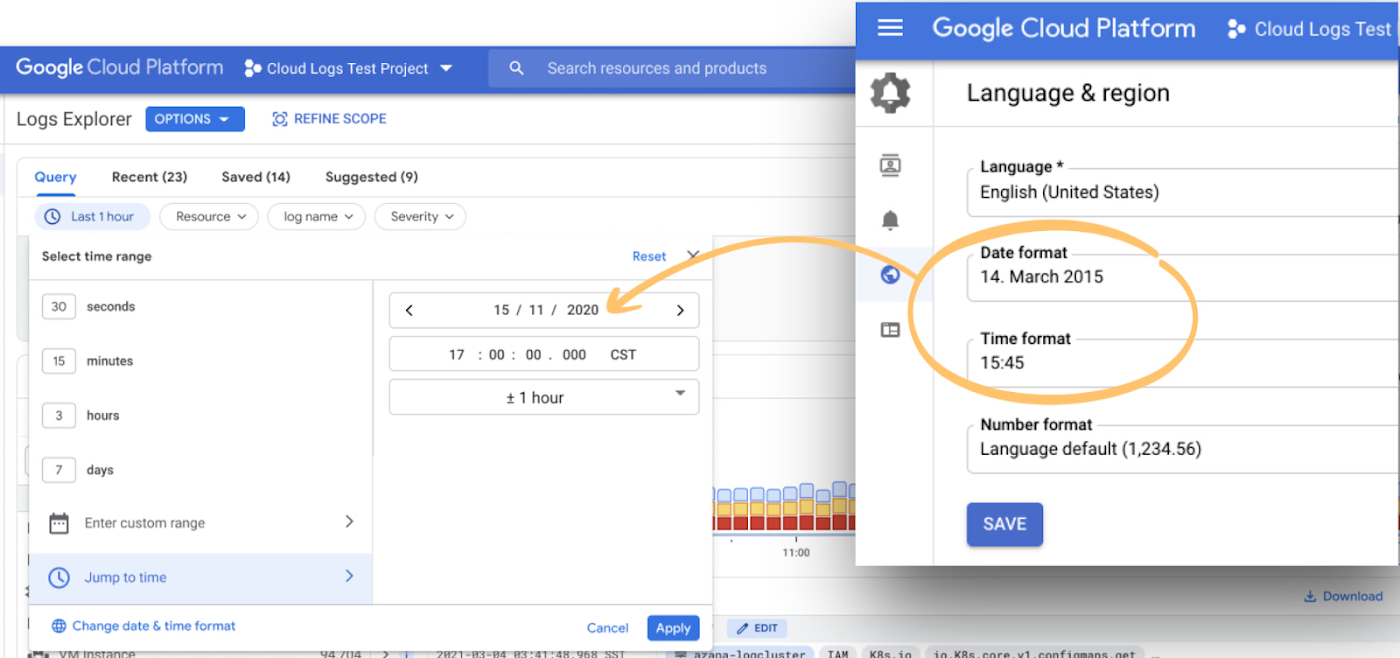
- Date/time preferences – the date/time display now respects date/time preferences set in the Cloud Console settings
- Dropdown selectors – prominently display the resource, logName and severity dropdown selectors
- Dropdown selector state – maintain the state in the resource, logName, severity, and free text search boxes whether building query via dropdown or by editing the Logging query language
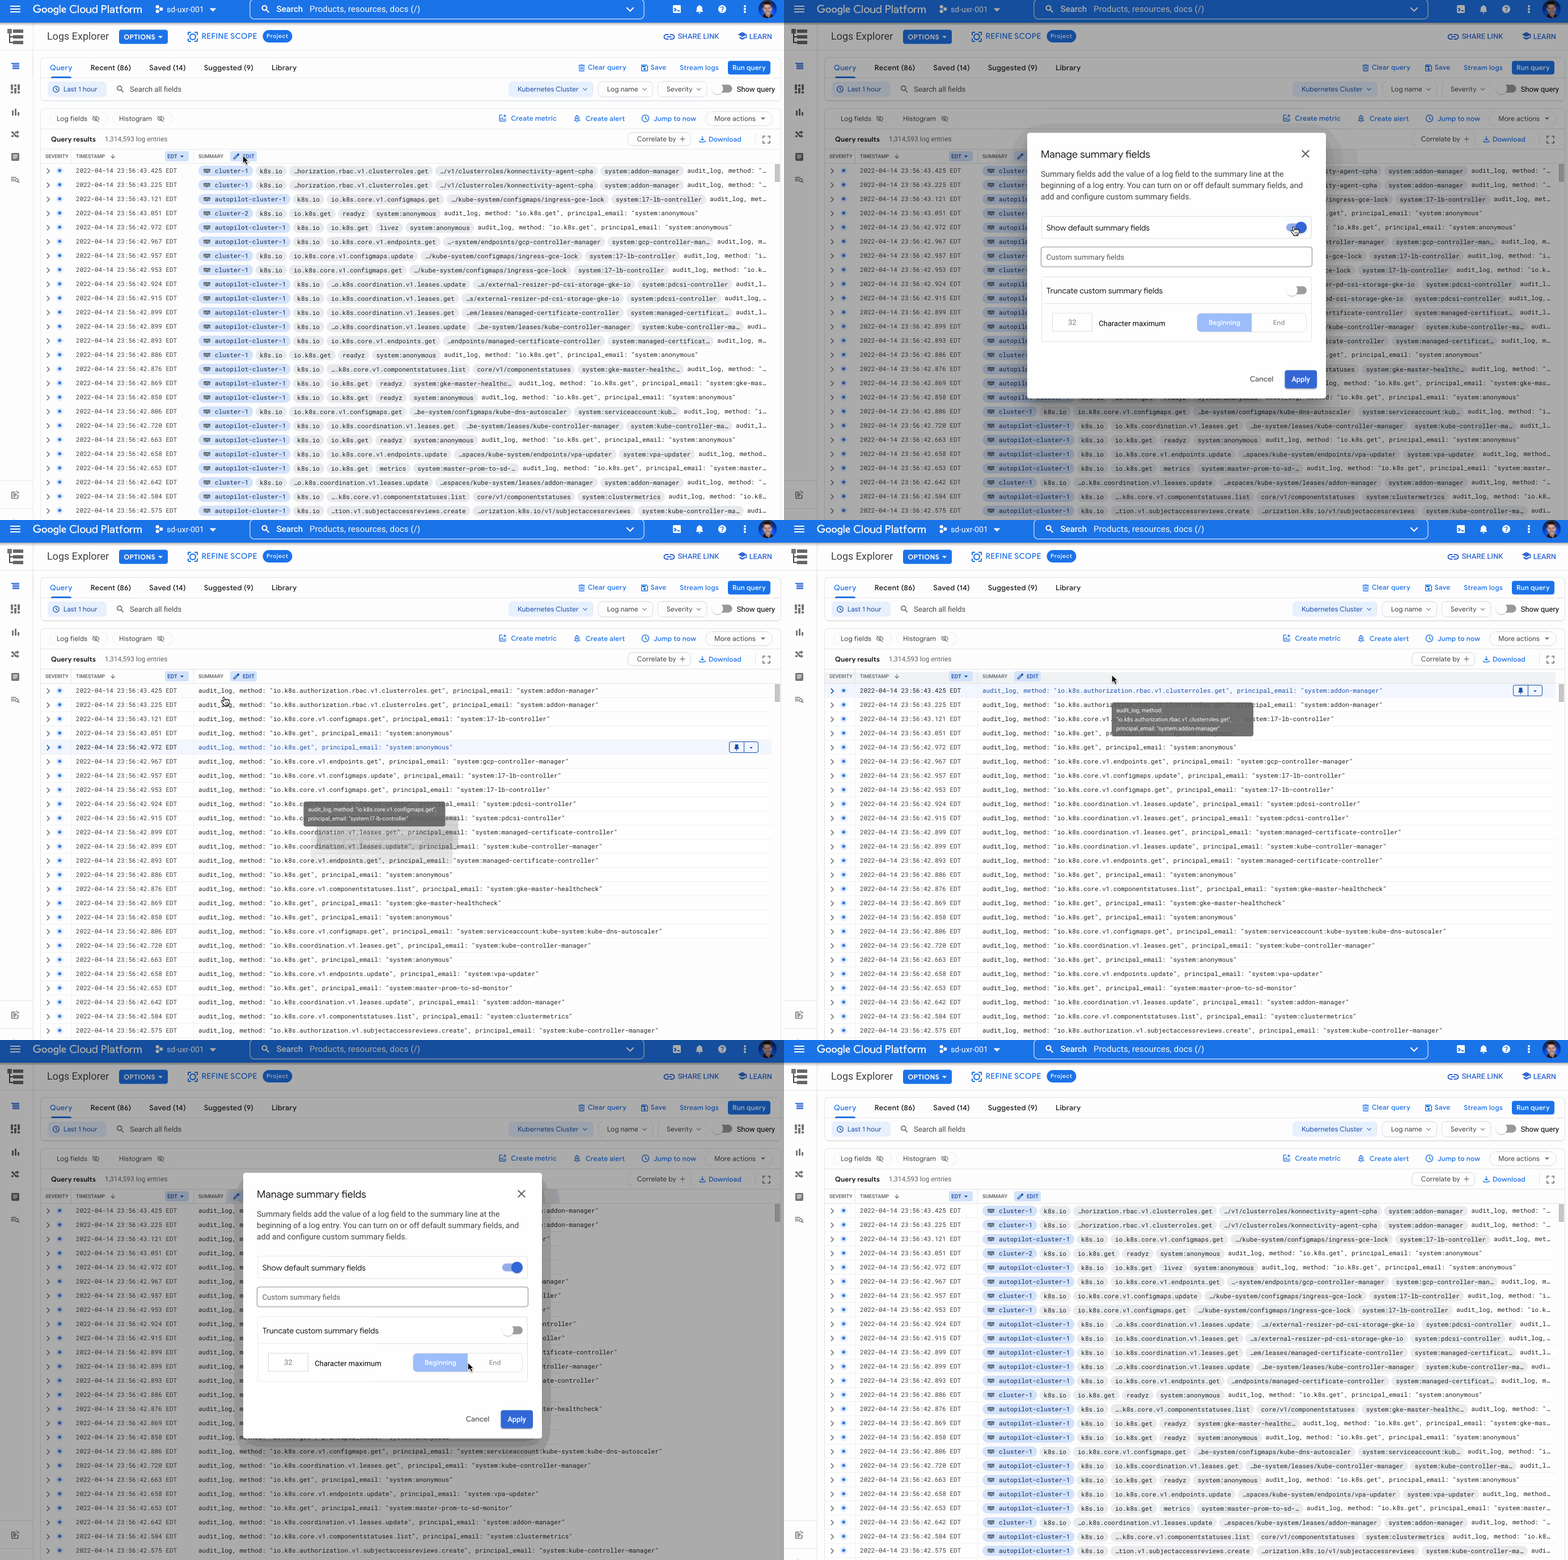
- Default summary fields – a new option to disable default summary fields for a more basic log view
Simple text search
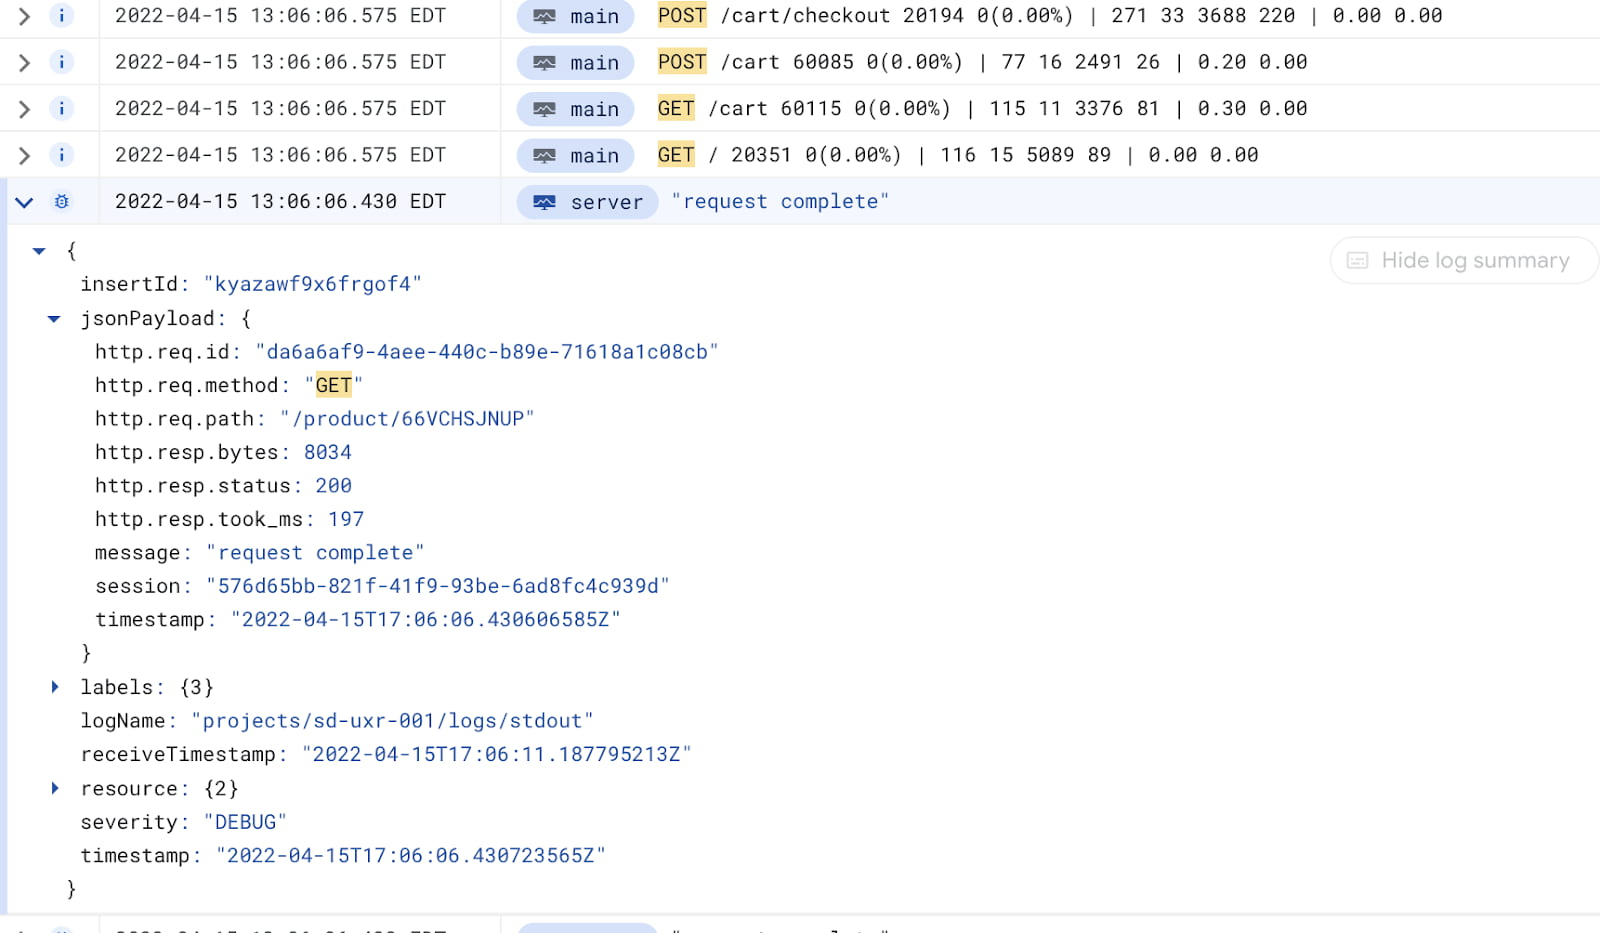
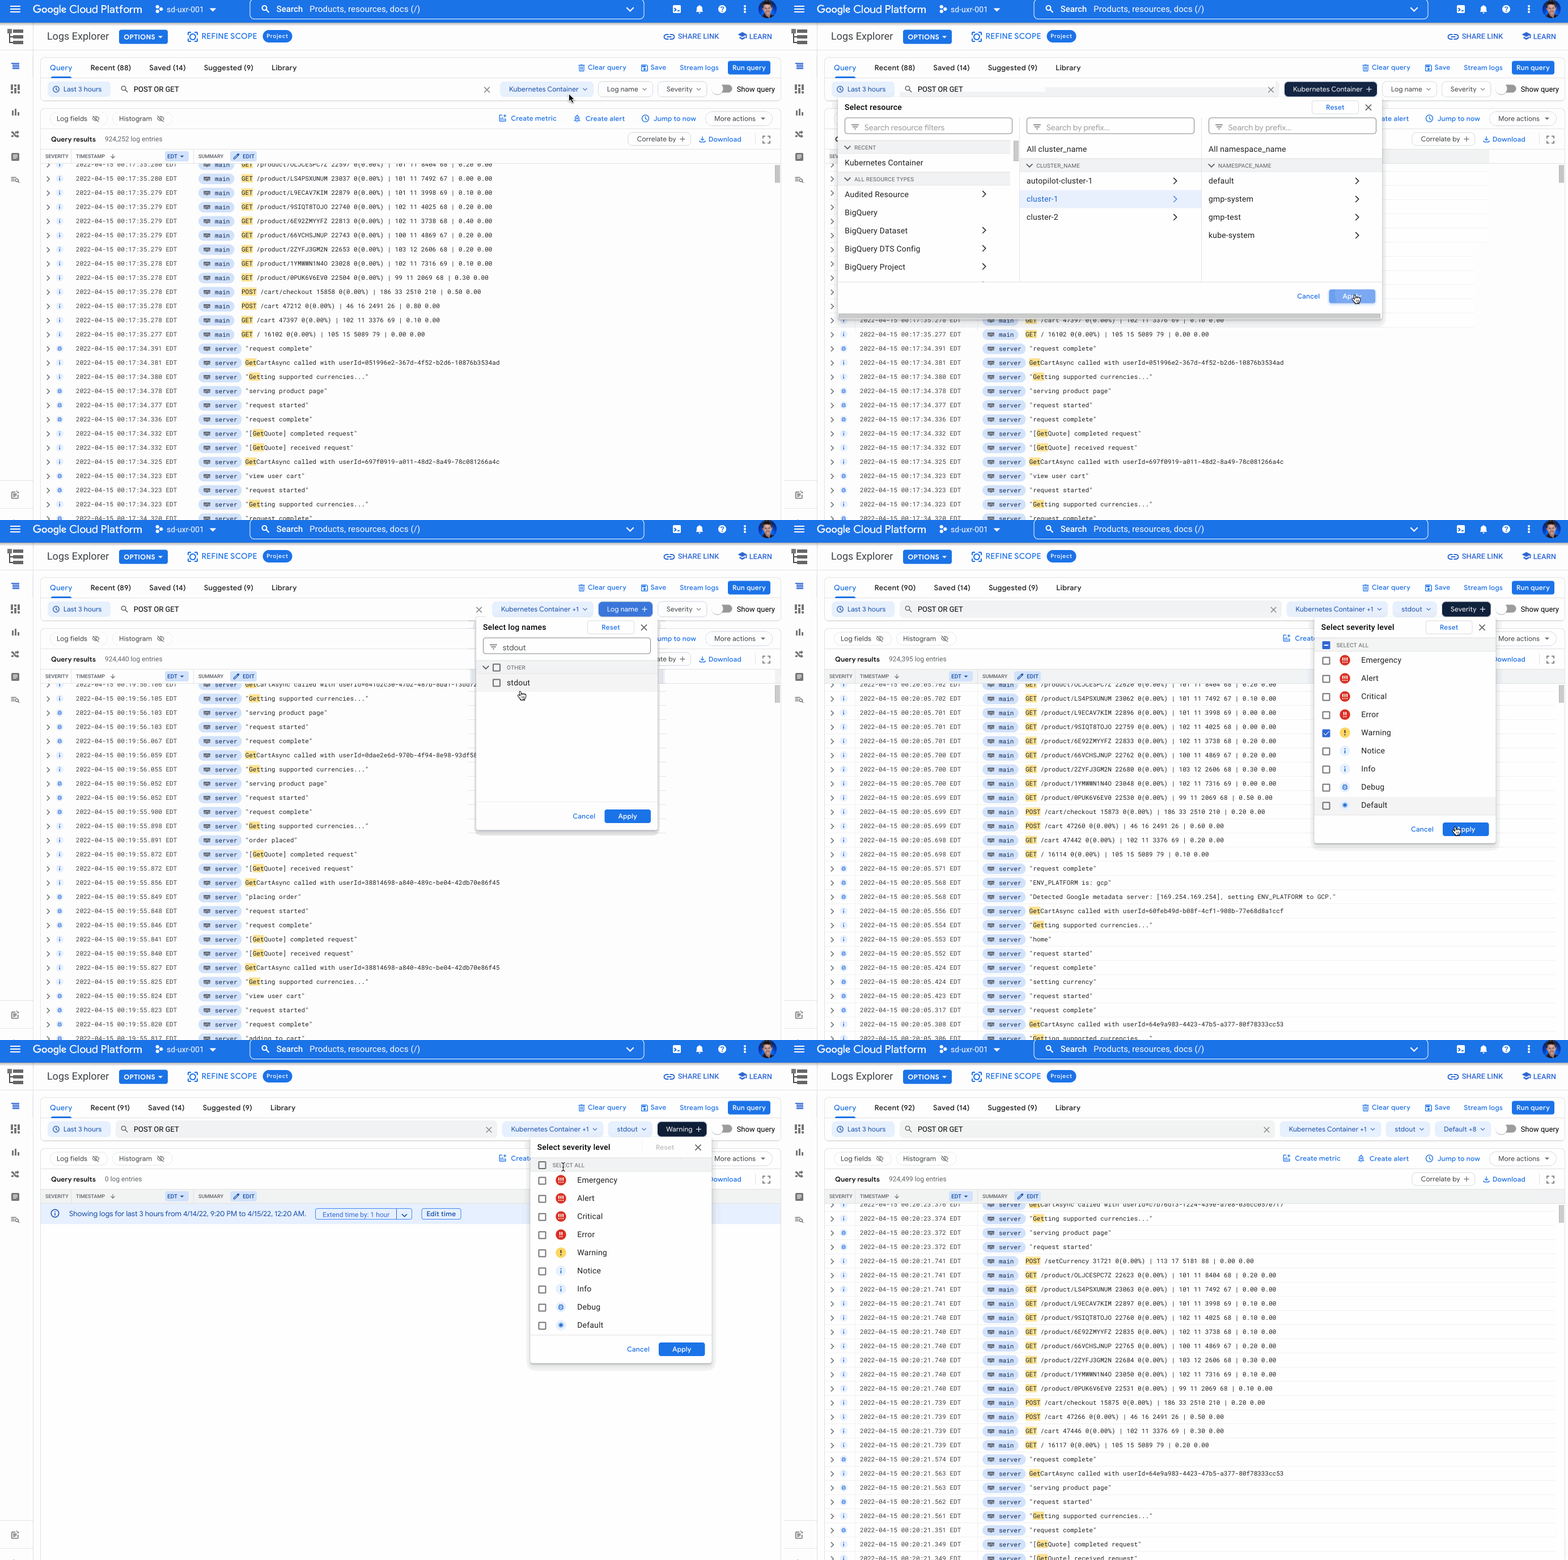
The new text search box performs global free text searches across your logs for the strings added to the text search box. For example, a simple “POST OR GET” will find any logs including the text “POST” or “GET” in any log field.

Additionally, you’ll see your query results highlighted both in the log summary line and the individual log entry itself.
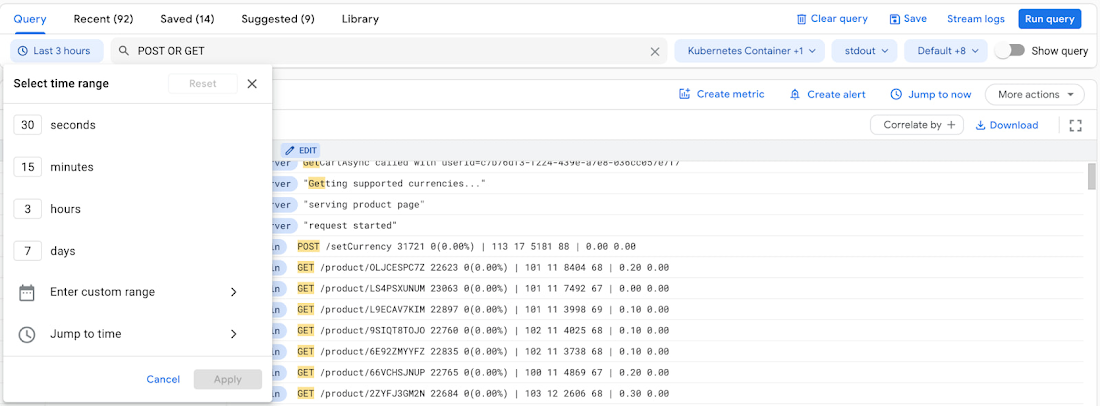
Show/hide query toggle
The new features simplify the query experience for many users, but the Logs Explorer still needs to allow users to to write complex queries for advanced use cases. That’s why they added the Show/hide query toggle which expands and closes the Logging query language behind the query.
You can use the Show/hide query toggle when the dropdowns just don’t cut it for your use case and you need to build conditional logic or regexes into your queries. You can update the Logging query language directly by selecting the Show/hide query toggle.

Date/time picker
Google moved the date/time picker location to be featured prominently as the first item in the query builder which makes it easier to find. While this move represents a relocation in the Logs Explorer user interface, they have a series of improvements that the team is actively developing to make it even easier to find the right logs for a date/time range.
Date/time display based on Cloud Console settings
Whether you’re a developer, DevOps engineer, SRE, or anywhere in between, working with dates can be difficult because of the different representations. With this change, the Jump to time and Enter custom range options in the date/time range selector will now respect your date and time format preferences set in the Cloud Console settings. This means, if you select mm/dd/yyyy or dd/mm/yyyy in your Cloud Console settings, you’ll see the date/time options in that format. When you select a 24-hour time format or an AM/PM time format, you’ll see the time options in your selected format.
Resource, logName, and severity dropdown selectors
The Logs Explorer now prominently displays the dropdown selectors for resources, logNames and severity. These dropdown selectors have also been improved so that they run the query each time a selection is made. This makes it easier to narrow logs quickly with each dropdown selection. Together, these changes make the dropdown selectors easier to find and more responsive.
Keeping the Logging query language and dropdowns in sync
When you use the resource, logName, severity dropdowns or add search text, Logs Explorer now builds a Logging query language query for you. For basic queries you don’t even need to look at the Logging query language. For more complex queries, you can edit the query language directly.
Here’s the interesting part: when you edit the query directly, the resource, logName, severity dropdowns and search text will be updated to match the Logging query language terms if they can be parsed and don’t include complex logical conditions.
For example, if you use the Show logs toggle to show the Logging query language and add the severity=ERROR, the severity dropdown is updated to show that ERROR is selected.

Next, if you select “DEBUG” from the severity dropdown, the query is updated to severity=(ERROR OR DEBUG).
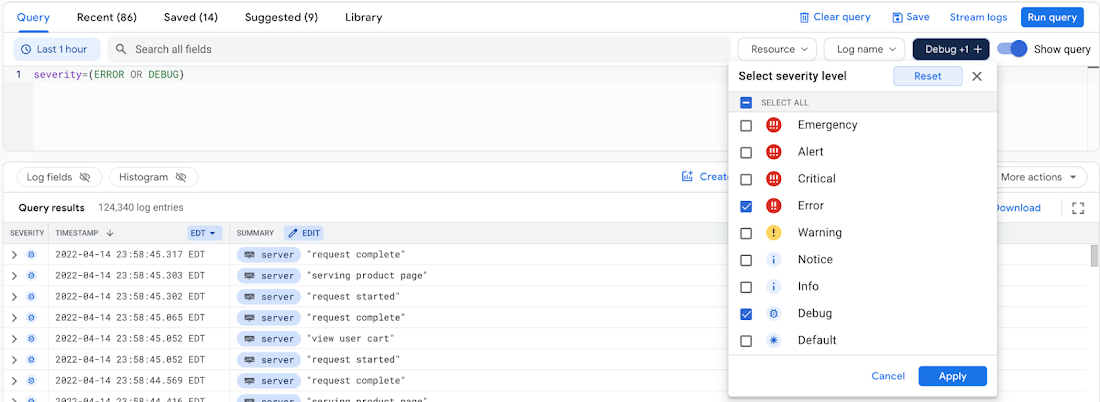
Maintaining the query state regardless of whether you’re selecting from the dropdowns or typing in queries means there is one less detail to remember when you’re querying your logs.
Disabling default summary fields for a basic log view
The Logs Explorer adds default summary fields to the log results to highlight useful information and make it easy to take action directly from the log line. For example, on App Engine logs, the default summary field chips highlight the latency which can help you more easily filter logs.
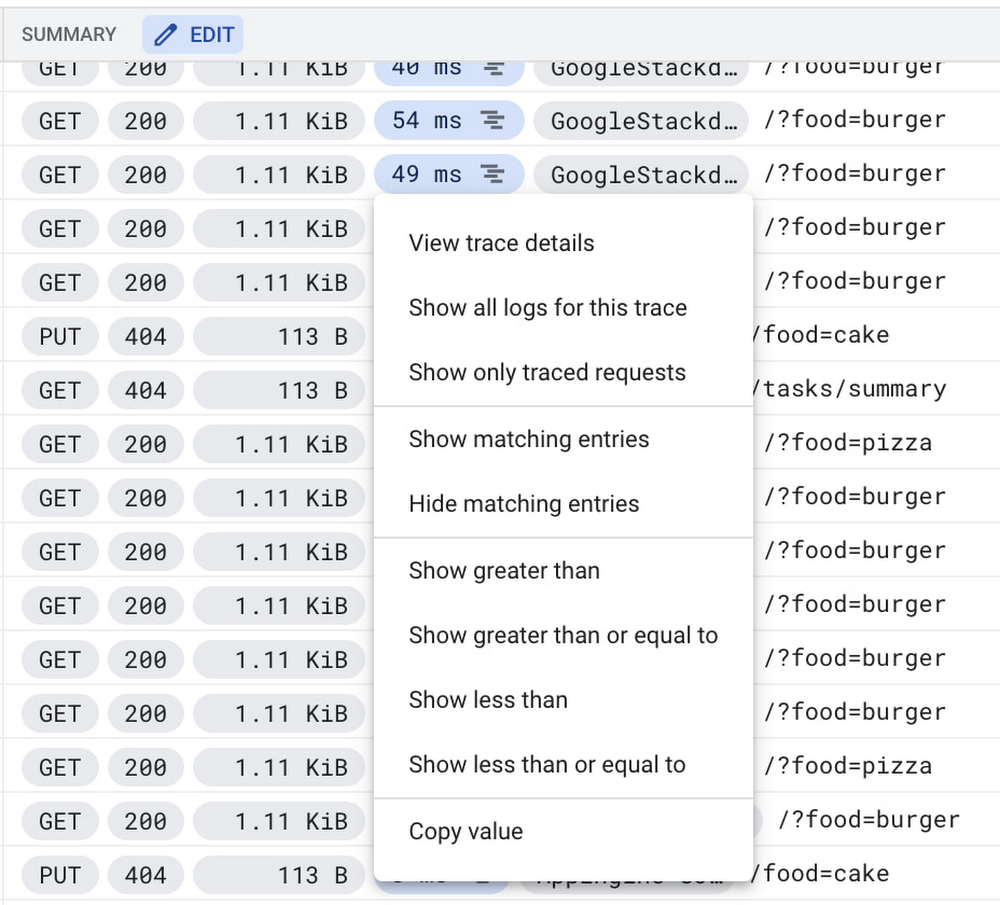
Logs Explorer also enables you to add your own custom summary fields to the log lines so you can view what’s most important to you about the log lines.
Google have heard feedback that sometimes all that’s needed is the raw text of logs. To show raw text logs, they’ve added a toggle to turn off/on the default summary fields for your log results for the duration of your session. By turning off the default summary fields, you’ll see only the raw text logs summary. To turn the summary fields back on, simply enable the toggle or start a new Logs Explorer session in a new tab.
The road ahead
They’re committed to making Logs Explorer where you can troubleshoot your applications running on Google Cloud. Over the coming months, they have many more changes planned to make Logs Explorer both easier and more powerful for users. If you haven’t already, get started with the Logs Explorer and join the discussion in the Cloud Operations page on the Google Cloud Community site.
