Behind the Scenes: WebGL-Powered Maps Demos for Google I/O
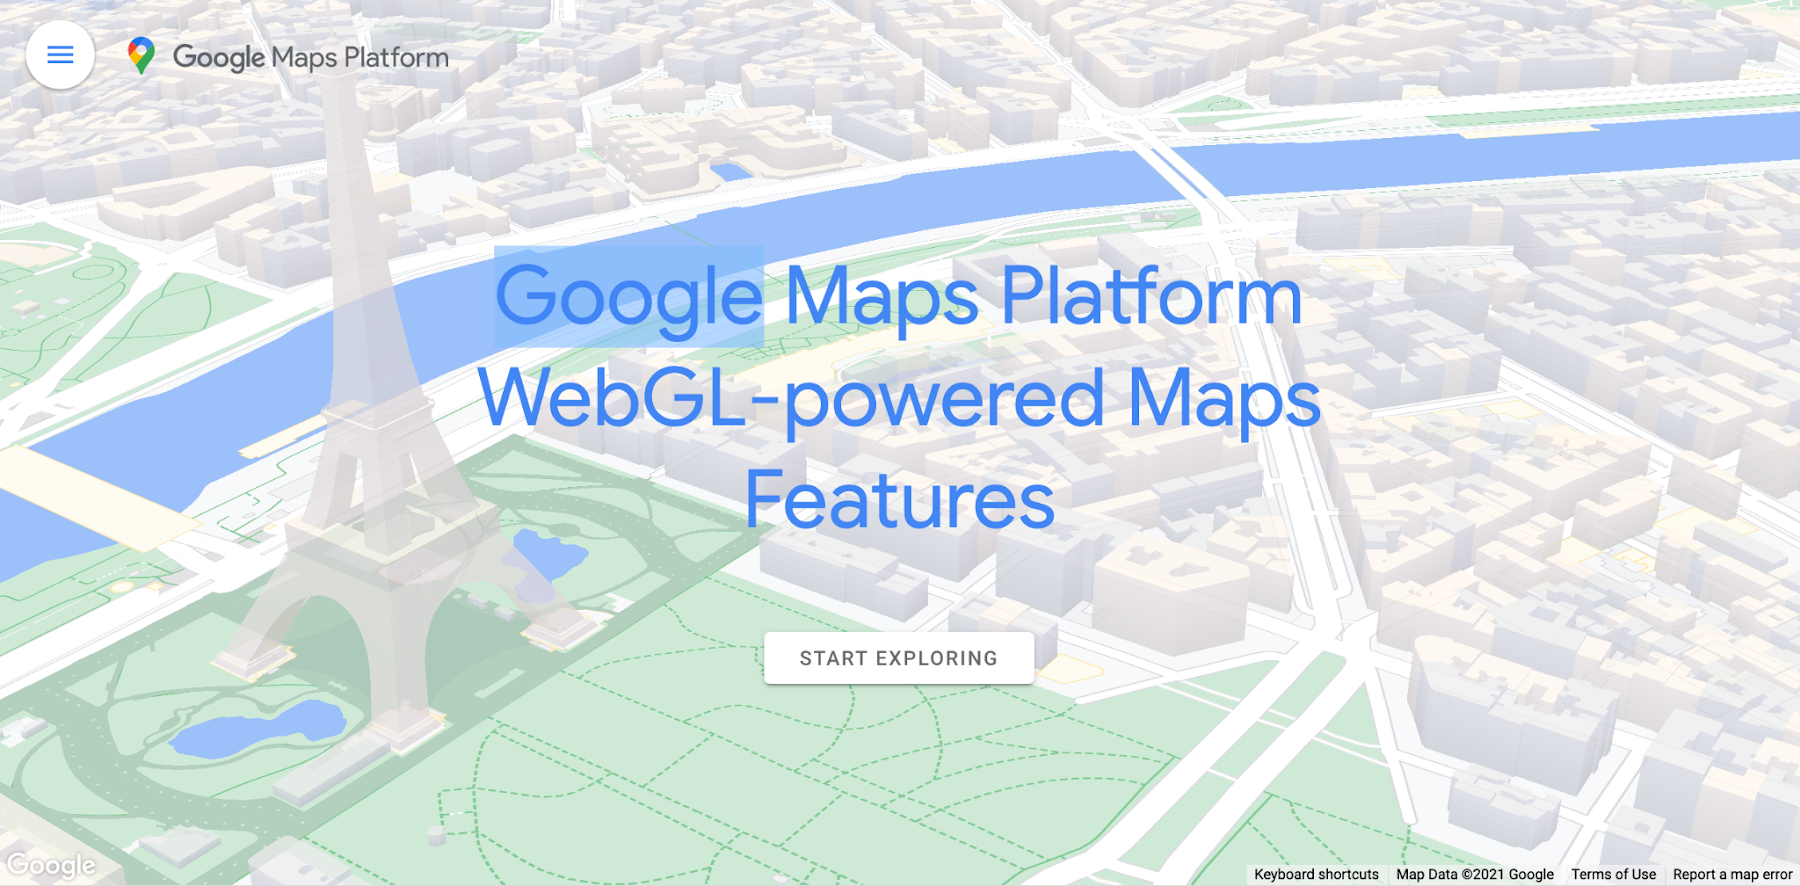
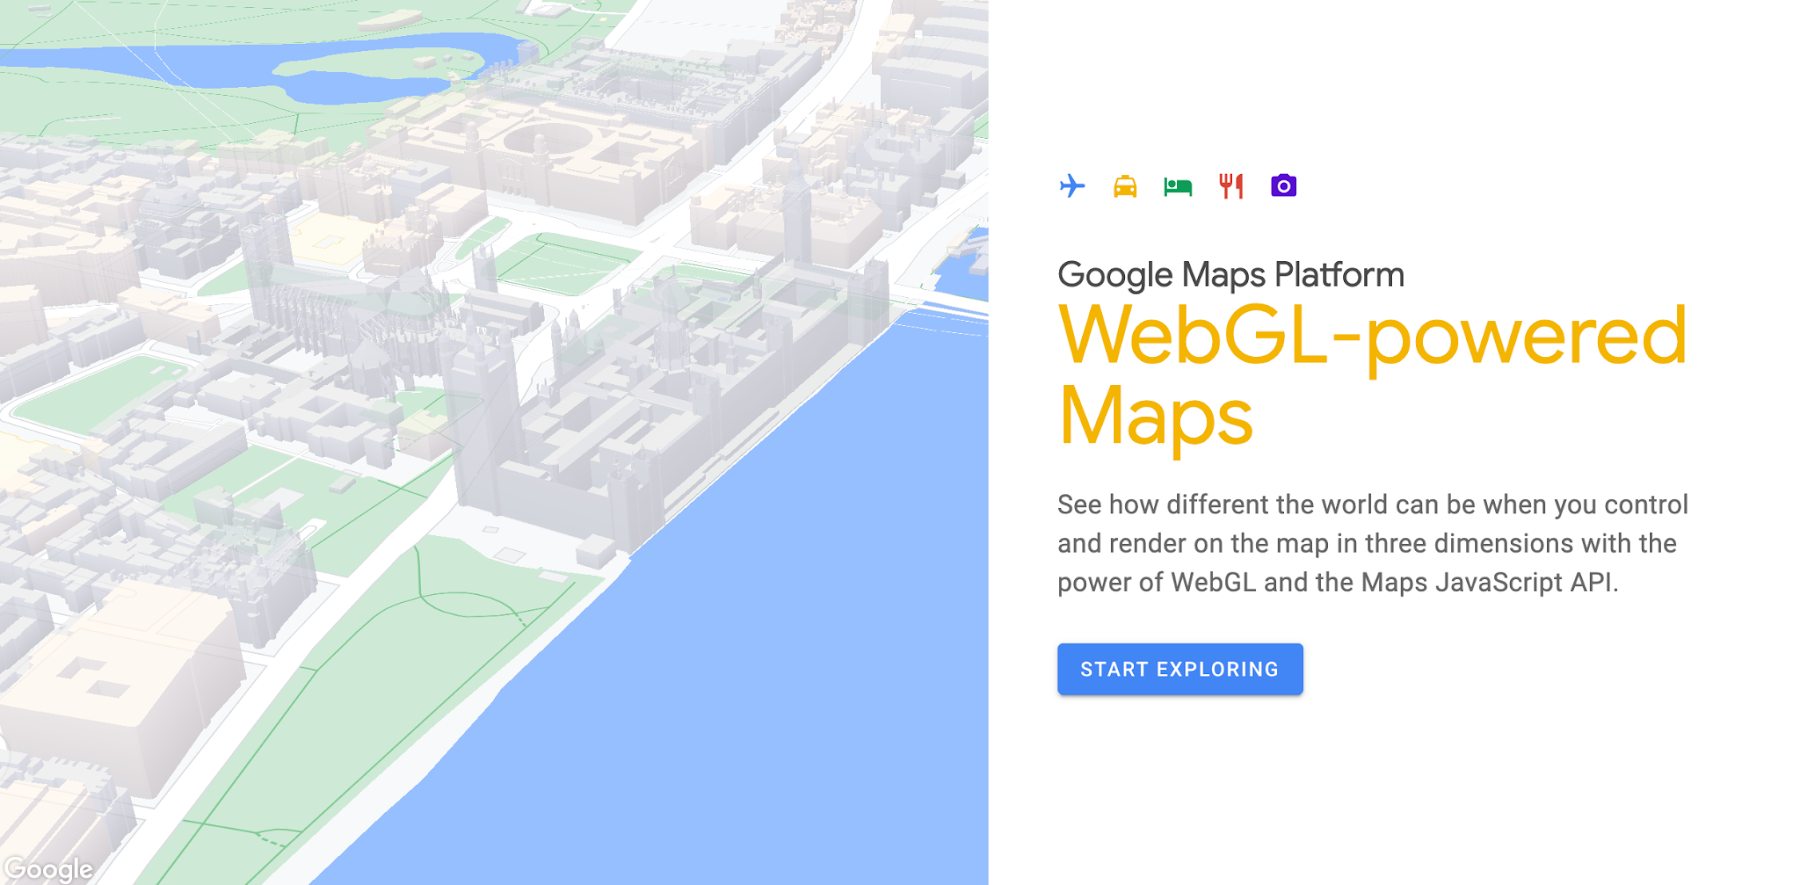
In preparation for the announcement of the beta release of WebGL-powered Maps features at Google I/O 2021, the Google Maps Platform team worked with Ubilabs, a Google Cloud partner since 2012, to show developers what’s possible when 3D rendering comes to the map. The first of these demos, ‘Google Maps Platform WebGL-powered Maps Features,’ walks developers through each of the WebGL features and how they can be used effectively.
The second demo, ‘Travel with Next Generation Maps,’ provides an end-to-end look at how the new 3D features in Google Maps Platform can transform mapping experiences, by applying them to a fictional travel app.
Showcasing new WebGL-powered Maps features
Martin Schuhfuss, a software engineer at Ubilabs who worked on the project, remembers talking with Google Maps Platform Engineering Lead Travis McPhail at Google I/O in 2019 about changes the Google Maps Platform team was considering for some of the APIs and working to support vector maps and even 3D content. Fast-forward to 2021, and Schuhfuss found himself on a call with the Google Maps Platform team about creating demos for Google I/O 2021 that would showcase Google Maps Platform’s new WebGL features. As a trusted Google Cloud partner, Ubilabs was entrusted with being early users of the features, which was likely to require some debugging and even the creation of initial documentation during the development process.
Ubilabs co-founder and head of development Martin Kleppe, a Google Maps Platform Google Developer Expert, also worked on the project, along with a project manager, a designer, and three other developers.
“We scoured the internet for interesting maps use cases, especially with a 3D aspect to it,” says Schuhfuss. “We were building small test pieces at the same time, to try out what we could do. The documentation didn’t even exist yet.”
Ubilabs decided to focus one demo on developers, walking them through the new capabilities step by step and showing them how to use them, with code samples included. The second demo, a travel app, shows the new features in the context of a plane flight, a taxi ride, finding a hotel, and going out to eat. Schuhfuss wrote text to guide users through the demo that effectively summarized everything he learned as one of the first users of the WebGL beta features. Much of that copy ended up in the documentation, to guide other users as they try out the features for the first time.
“For each feature, we asked ourselves, what could we do with Google Maps Platform to show what you can do now and how it could look?” says Schuhfuss. “We decided to create a travel demo, to showcase the whole process of going on a trip to a city.”
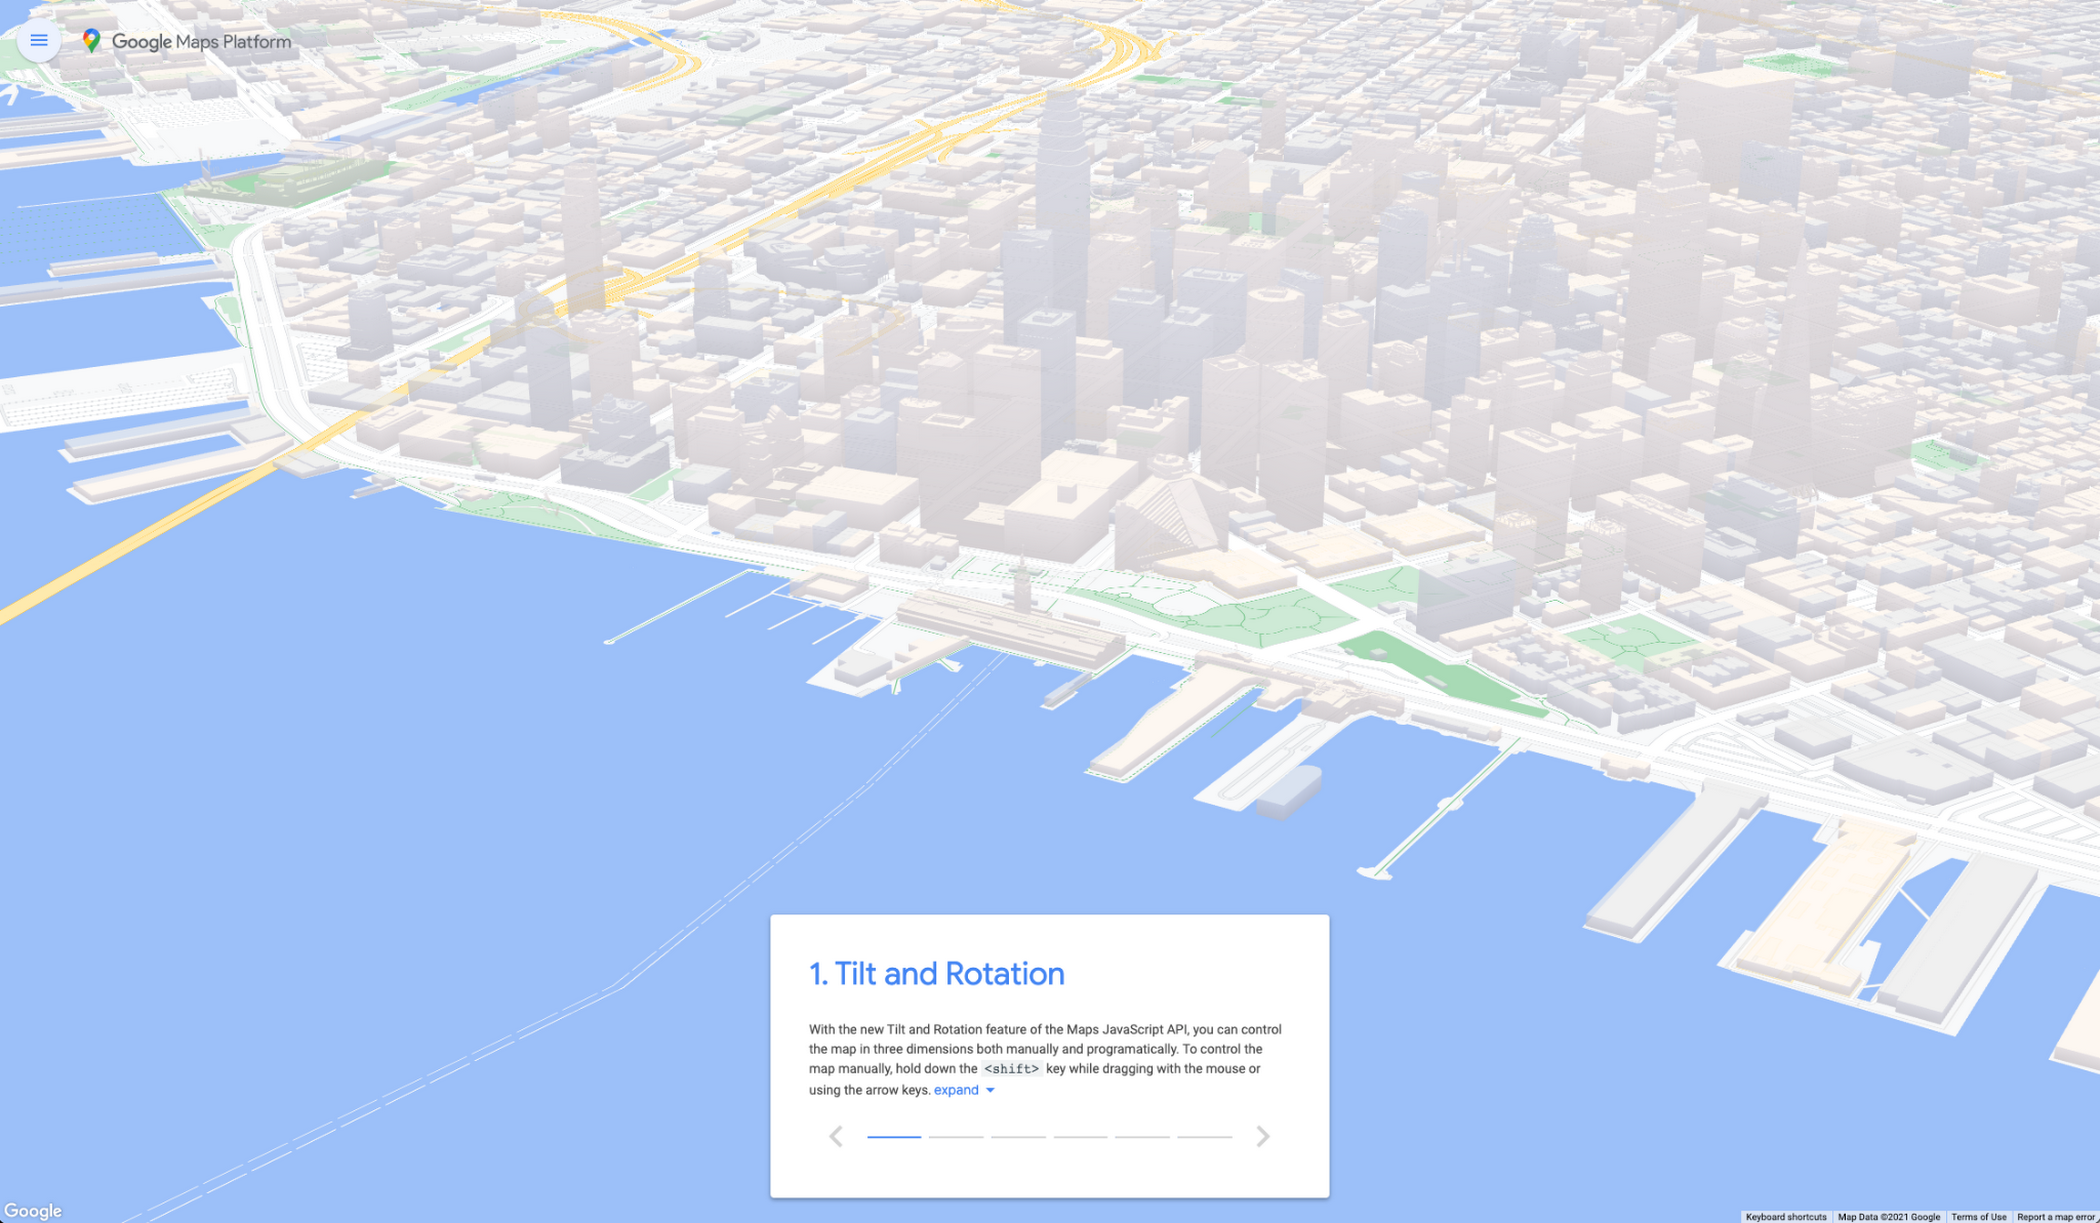
Developers are used to seeing north-up maps, with 2D top-down views, so Schuhfuss was excited to show them how they could animate the camera and add information to the map using verticality in any storytelling context. For example, in the screenshot below, notice how just adding a simple tilt and rotation to the map changes the whole experience.
“The technology underlying the WebGL features uses GPU accelerated rendering services, where you use the graphic card in your machine to render 3D buildings and place 3D objects in space,” explains Kleppe. “Before, your data was an additional layer on top that covered the map, and now, you have a new level of control. This will provide the user an immersive experience, like looking at a view of a city.”
The team created smaller demos first, then put them in the larger context of click-through demos. When something didn’t work as expected, Ubilabs tried to troubleshoot and collaborated with the Google Maps Platform engineering team to fix the issue. In one case, when Schuhfuss added three different objects to a scene, the third object consistently disappeared after a few seconds, and the second object disappeared after another few seconds. Ubilabs shared feedback about the issue with the Google Maps Platform engineering team, who were able to solve the problem in the following release to improve the product for users.
“I spent time debugging, trying to figure out what was happening,” Schuhfuss says. “In order to have the ability to have occlusion–stuff you render to hide behind buildings, you need to share the WebGL context–the interface that lets you talk with the graphics card, and it’s really sensitive to small state changes.”
Schuhfuss found that the rest of the development involved fairly straightforward Three.js capabilities, except understanding and computing coordinates from latitude and longitude. The team had regular calls with the Google Maps Platform team to sync on their progress and address technical questions and updates.
Interactive Demos for Google I/O
Ubilabs made sure to conclude each demo by showcasing something impressive developers could create using WebGL features.
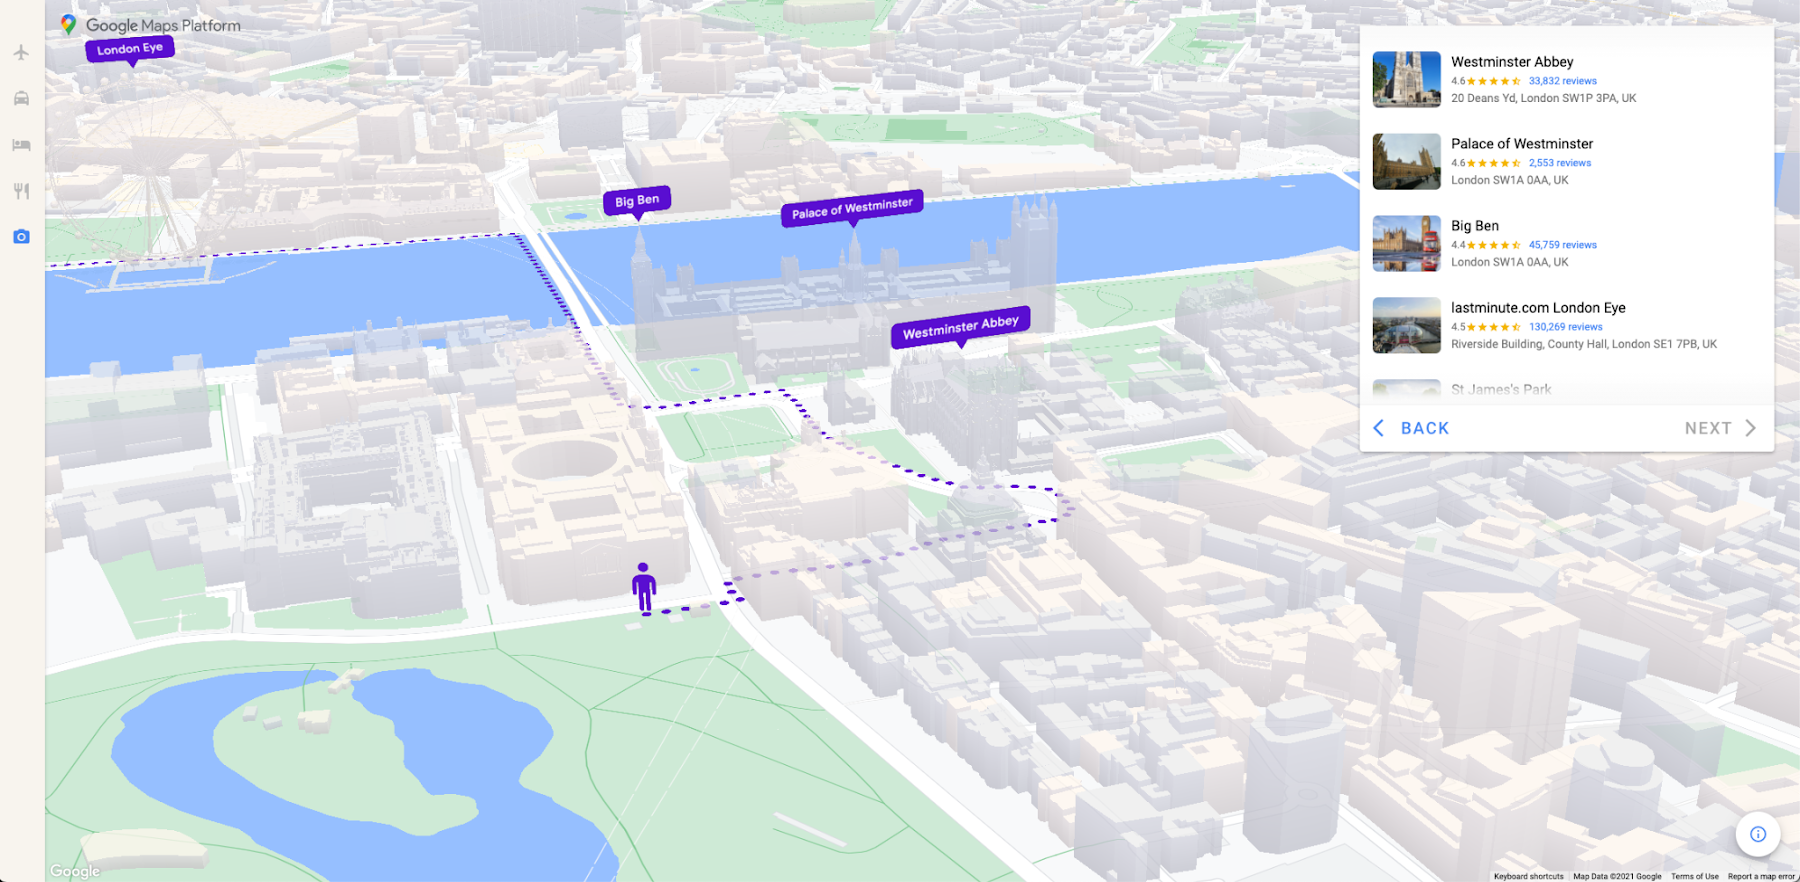
“The last page of the travel demo is my absolute favorite,” says Schuhfuss, who completely rebuilt that page several days before I/O. “What I love about that is the way the text labels behave when you rotate the camera around, and that they get these little stems when the buildings disappear.”
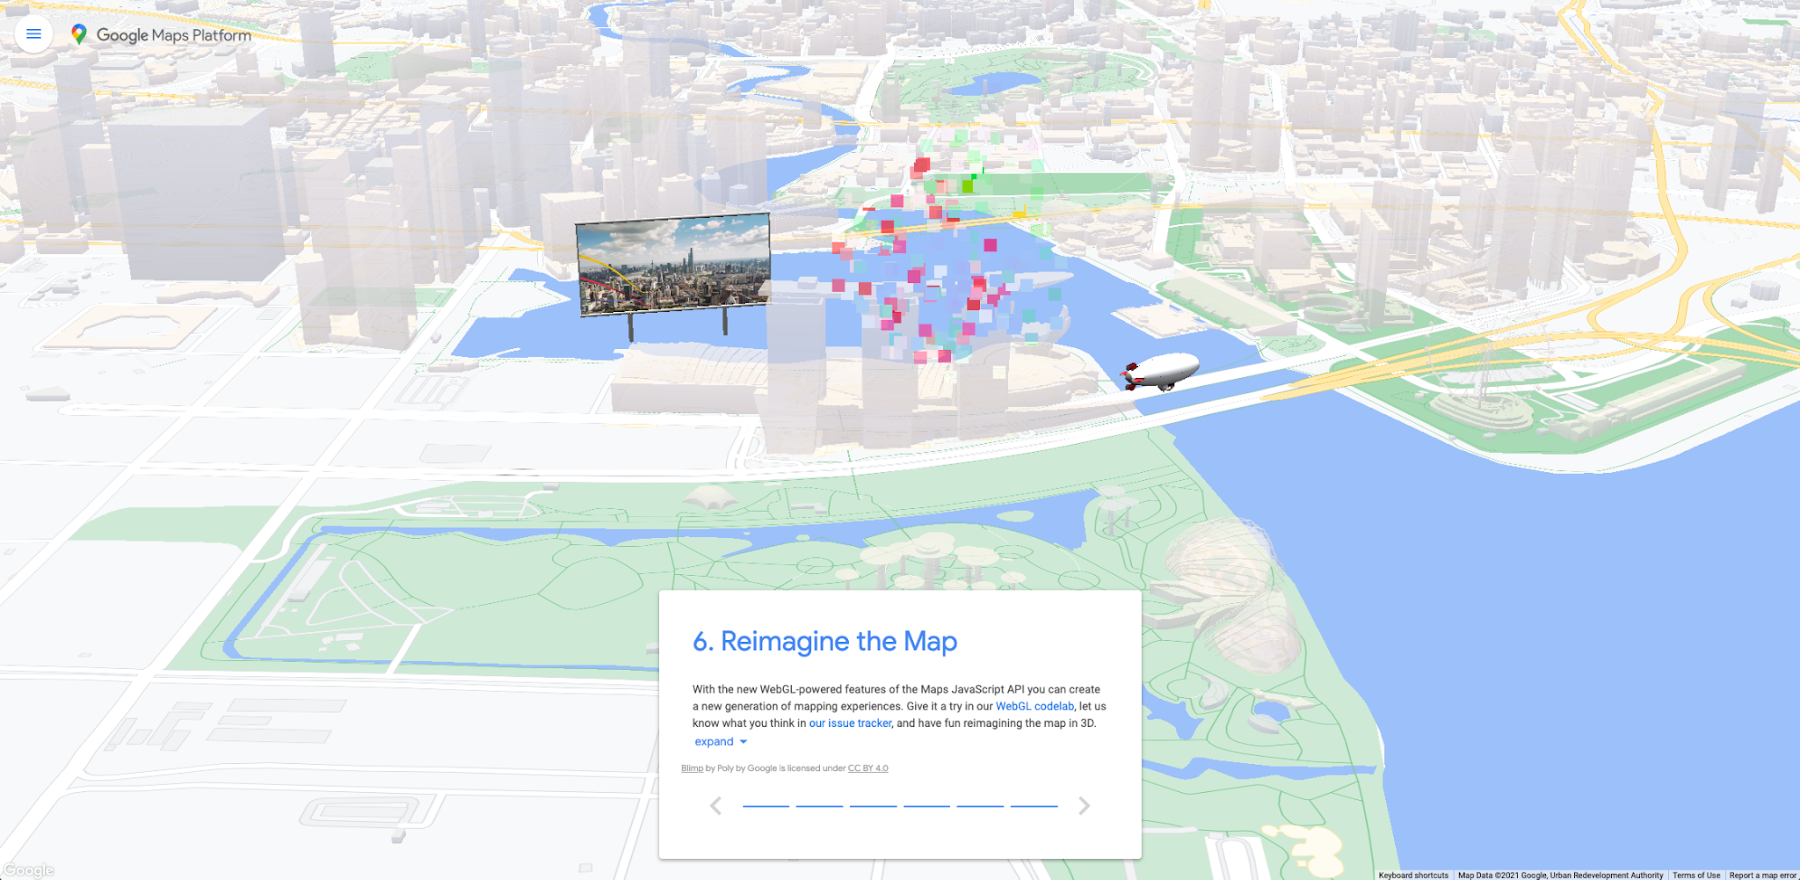
The last page of the developer-focused demo encourages users to ‘Reimagine the Map’ and includes embedded video and fireworks.
“The next best thing was the fireworks,” Schuhfuss says. “We are able to embed video, and we wanted to show that somewhere, so we built the video wall in the harbor. I think at some point during development it even played Rick Astley.”
“We can combine many different data sources—the base map with streets, a layer to draw business information, an extra API to calculate directions, and then you can place your own information on top of that,” he says. “You’re not limited to the set of data in the API; you’re always free to merge your own data in an abstract view of the world.”
Schuhfuss, who also runs the three.js community slack workspace, says he has seen many awed responses online.
“I’m really looking forward to seeing examples of people using these features,” he says.
Need a help?